This post is a continuation of the last PISA post. This post focuses on PISA2009 since that was the last Reading focused PISA assessment set. As I read through the document, PISA 2009 Results: What Students Know and Can Do, I started wondering what else in the PISA data and reports can be used to narrow in on the differences in the educational systems between New Zealand and the United States.
Score Distributions
The first important piece of information comes from Figure 1.2.14 from the PISA 2009 Results document. But, before I talk about the score distributions, I need to explain the Levels used in PISA to show score distributions. Remember that PISA is an assessment of 15 year old students. PISA Reading uses eight levels to classify student scores. Levels 5 and 6 are the highest. Students in these levels can handle unfamiliar texts by finding information within the unfamiliar texts, demonstrating detailed understanding of the text ,and making inferences based off the unfamiliar texts. Level 2 is considered the “baseline level of proficiency, at which students begin to demonstrate the reading literacy competencies that will enable them to participate effectively and productively in life” (OECD, 2010, p. 52). Students at level 1b can, “locate a single piece of explicitly stated information in a prominent position in a short, syntactically simple text with familiar context and text type such as a narrative or simple list” (OECD, 2010, p. 53). More detailed descriptors are available on the PISA website.

Figure 1.2.14 gives a better picture of reading in both New Zealand and the U.S. than the mean scores. Here are notes I have from this Figure.
- New Zealand has a smaller percent of students below the Level 2 threshold than the United States.
- New Zealand has a larger percent of students in Level 4 and Level 5 than the U.S.
- Both countries have about the same percent of students in Level 1b and Level 3.
By using the Levels distributions, we can now see that not all students in New Zealand are more advanced readers than U.S. students. In fact, both countries have struggling readers. Both countries have about the same percent of 15 year olds that are or are very close to being illiterate. Where New Zealand is different, though, is that it has a smaller percent of students at the foundation level (Level 2) and a larger percent of students at mid-advanced levels (Levels 4 & 5). In fact, New Zealand has more than double the OECD average of percent of students in Level 5 (OECD, Executive Summary). In a later post, I describe the educational system in New Zealand as well as social and pedagogical reasons why I think New Zealand has these score distributions.
Gender Gap
Comparing gender gap in reading between the United States and New Zealand is interesting because it encompasses a national concern in New Zealand while also showing the U.S. has a smaller gap, but also lower scores. The figure below is Figure 1.2.17 from the PISA 2009 Results document.
At first glance, the United States needs to be congratulated on such a narrow gender gap in reading while New Zealand struggles with a very wide gender gap in reading. However, looking closer, the boys in both countries score, on average, about the same. The girls, though, score differently between the two countries. Girls in the U.S. score only slightly higher than boys in the U.S.. But, girls in New Zealand score much higher than boys in NZ and even girls in the U.S.. So if the focus is on the gender gap, the U.S. is doing better. But, if the focus is on reading in general, it appears that the girls in New Zealand are pulling the NZ scores higher, and thereby giving NZ higher mean reading scores on PISA. New Zealand is trying to figure out why their boys are reading much lower than their girls while the U.S. is trying to figure out how to get both genders to read at higher levels.
Equity
PISA 2009 also looked into equity of education. The socio-economic backgrounds of students, on average, was related to student scores. There are some countries where students from lower socio-economic backgrounds perform at the same levels as students from higher SE background, but those were rare. On average, students from low SE background performed 38 points lower on reading (about 1 year’s worth of learning) than students from high SE backgrounds. The U.S. is about average. New Zealand, however, is worse than average. The score gap between SE backgrounds is more than 50 points (OECD 2010, Executive Summary).
In my opinion, New Zealand has a more equitable funding program for schools. Schools are funded at the national level and schools in lower socio-economic areas receive more funding than schools in higher socio-economic areas. Also, teachers are paid on a national salary schedule. However, there are also historical and cultural elements that are, in my opinion, negatively impacting equity in NZ schools. I’ll explain the funding model in another blog post.
So if NZ has a more equitable school funding model, why does the SE gap play out more in the PISA scores than in the U.S.? That, my friends, is a major research question I have. I have a few working hypotheses based on my time spent in schools, but I’ll get into that in another post.
Trends for New Zealand
In an earlier post, we saw that the New Zealand reading scores are declining. Earlier in this post, we compared the reading levels in New Zealand to the reading levels in the U.S. Below is a graph from the PISA 2012 New Zealand summary report.
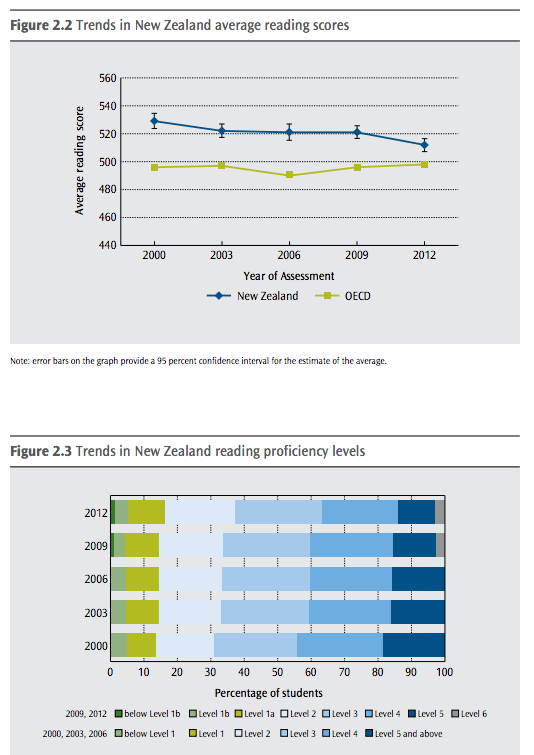
As you can see above, there hasn’t been much of a change in the percentage of students in Level 3. There has been, however, a decrease in Levels 4+ and an increase in Levels 2- since 2000. I have a working hypothesis as to why this is happening. My hypothesis is a combination of a few factors that first require an understanding of the historical and cultural contexts of the New Zealand education system. Since this post is already very long, I will save the details of the history and culture of NZ schools for another post.
References
May, S., Cowles, S., and Lamy, M. (2013). PISA 2012 New Zealand summary report. Retrieved from: http://www.educationcounts.govt.nz/__data/assets/pdf_file/0008/144872/1015_PISA-Summary_2012.pdf.
OECD (2010), PISA 2009 Results: Executive Summary
OECD (2010), PISA 2009 Results: What Students Know and Can Do – Student Performance in Reading, Mathematics and Science (Volume I) http://dx.doi.org/10.1787/9789264091450-en
