The 2012 PISA assessment focused heavily on math. Below are the relevant graphs and discussion.
Score Distributions
Both of these graphs come from the PISA2012 Results Volume 1 document.

Table 1A from PISA2012 Report

Figure 1.2.22 from PISA2012 Report
From these two graphs, we can see that New Zealand and the U.S. have approximately the same percentage of students below Level 2 mean scores in mathematics. Just like reading, Level 2 in mathematics is considered the foundation level one needs to function in everyday life. The United States, though, has a larger percentage of students in Level 2 than New Zealand does. Bot countries have about the same percent of students in Levels 3 and 4. New Zealand, though, has a much larger percent of students in Levels 5 and 6 than the U.S.. In fact, NZ has about twice the percent of students in these high levels than the U.S.. New Zealand’s higher average math scores come from the larger percent of students performing math at Levels 5 and 6.
Mathematics performance is broken down further into subscales and content areas within the PISA mathematics assessment.
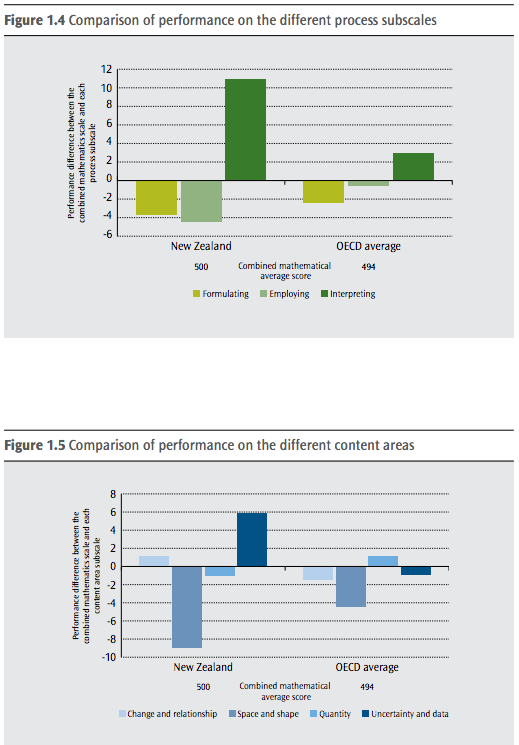
Figures 1.4 and 1.5 from the PISA New Zealand document
New Zealand students, on average, perform better at Intrepreting and Uncertainty & Data while performing worse at formulating, employing, and Space Shape than the OECD average (May, 2013).
The U.S. report doesn’t provide nice graphs like the New Zealand report. Instead, in the U.S. report, strengths and weaknesses of students are described. The U.S. PISA report explains that U.S. students, on average, are very strong in interpreting mathematical results from single graphs and handling well-structured formulas. Also, U.S. students perform very well in Change and Relationship tasks, but poorly in Space and Shape which is very similar to New Zealand. U.S. students, though, struggle with applying mathematics to problems different than the context in which the mathematics was learned. The report states that U.S. students struggle with higher cognitive demands in mathematics and suggests that learning of mathematics shift more towards mathematical modeling (OECD United States, 2013).
Gender
While students, on average, in New Zealand score higher than students in the U.S. on the PISA math assessment, the U.S. has a much smaller gender gap in mathematics than New Zealand. Remember that PISA assesses 15 year old students so the gap we see in the data below is just a snapshot of the gender gap for 15 year olds.
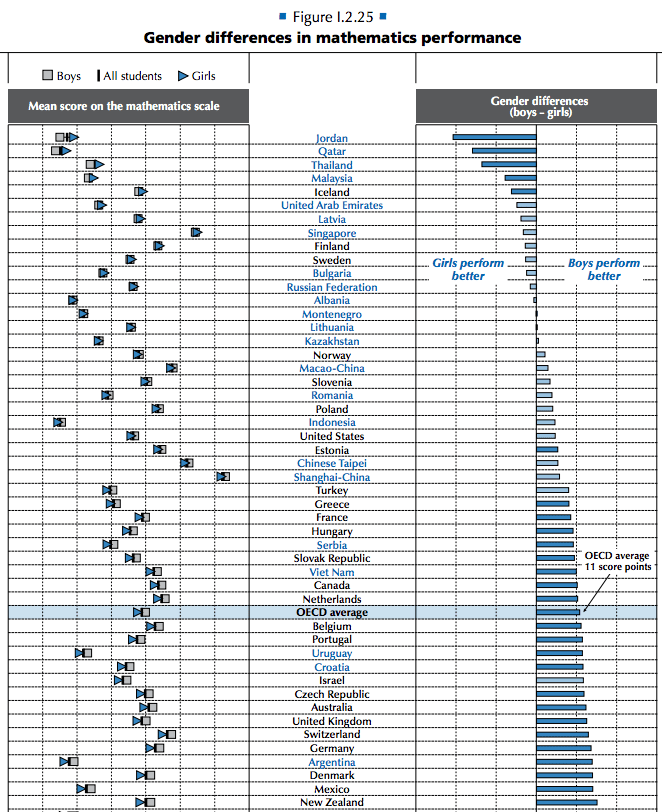
Figure 1.2.25 from the PISA2012 Results document
Equity
Equity in mathematics is the same story as equity in reading. Before I go further, though, I think its important to define equity from the PISA reports. PISA uses multiple measures to construct an equity index. These measures include the quantity and quality of educational resources within schools, class time devoted to learning, after school activities, and socio-economic status of families. This data is collected through surveys to students, parents, and school principals.
For my purposes of discussing equity, I focus just on the socio-economic status of families. PISA defines socio-economic status as a combination of family income, parental education, and household items associated with wealth (OECD, 2013). The figure below shows the change in socio-economic status of families with performance on the PISA mathematics assessment.
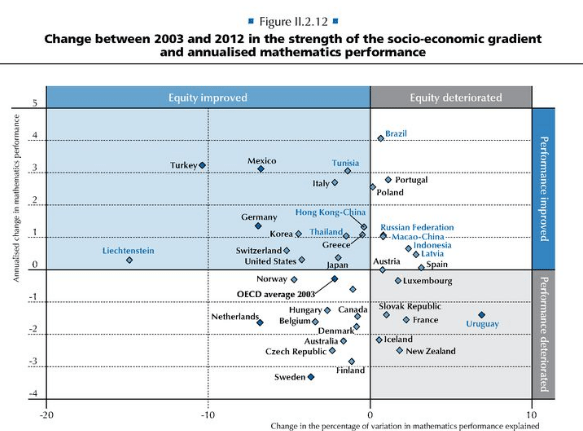
Figure 11.2.12 from the PISA2012 Equity document
As you can see, in New Zealand, the differences in socio-economic status of families increased while mathematics performance decreased from 2003 to 2012. The opposite happened in the U.S.. In the U.S. socio-economic status differences between families decreased while mathematics performance slightly increased. The PISA Results report also states that socio-economic differences between families explains more than 75% of the performance differences between schools (OECD, 2013). New Zealand has a very large socio-economic disparity between schools. The U.S. ranks about average in terms of the share of students from disadvantaged backgrounds (OECD United State, 2013).
I have a hypothesis for this equity problem which centers around sampling bias and a few schooling and housing factors that are running through New Zealand . But, I’ll get to that in another post…
Summary
While New Zealand students score, on average, higher than U.S. students on the PISA mathematics assessment, their scores are dropping rapidly. New Zealand also has a very large equity problem between schools along with a larger gender gap (but both genders in NZ score higher than U.S. students). U.S. students are very good at simple mathematical tasks, but struggle with more real-world application of mathematics. This doesn’t mean more students need to take Calculus. What it does mean, is that U.S. students need to learn applied mathematics better at all levels of schooling.
I’ll conclude this post with a reminder that PISA is a snapshot and standardized assessment of 15 year olds. I plan to eventually look at TIMMS and PIRLS to get a better idea of learning in the two countries at younger ages. Also, I plan to do a comparison between what PISA measures and what TIMMS and PIRLS measure. As time permits, I’ll investigate TIMMS and PIRLS.
References
May, S., Cowles, S., and Lamy, M. (2013). PISA 2012 New Zealand summary report. Retrieved from: http://www.educationcounts.govt.nz/__data/assets/pdf_file/0008/144872/1015_PISA-Summary_2012.pdf.
OECD (2013), PISA 2012 Results: County Note: United States. Retrieved from https://www.oecd.org/unitedstates/PISA-2012-results-US.pdf
OECD (2013), PISA 2012 Results: Excellence Through Equity: Giving Every Student the Chance to Succeed (Volume II), PISA, OECD Publishing. http://dx.doi.org/10.1787/9789264201132-en
OECD (2014), PISA 2012 Results: What Students Know and Can Do – Student Performance in Mathematics, Reading and Science (Volume I, Revised edition, February 2014), PISA, OECD Publishing. http://dx.doi.org/10.1787/9789264201118-en
